Follow Us


How to do an Affinity Diagram
The Affinity Diagram is a method developed in the 1960s by a man called Jiro Kawakita and is sometimes called therefore, the KJ Method.
It is mainly used in Project Planning and is listed as being one the Seven Project Management tools.
The Affinity method or diagram is used to make sense of information.
After carrying out a brainstorming, the ideas are gathered into groupings and this helps to:
- Organise ideas
- Set priorities
- Problem solve

Steps in doing an Affinity Diagram
- Carry out a brainstorming session. Ensure that all the key people are present - the key stakeholders, if you so wish.
- Note all ideas, problems, issues, concepts on small slips of paper. Post-its, metaplan notes, record cards or similar. The main thing is that the different ideas are easy to move around, as grouping and grouping will take place.
- Once you have your array of ideas, try to group them. Do this according to topics that each could be associated with. In other words,group them into topics where they have an Affinity with each other.
- Display the ideas in their groupings and discuss with your team. Re-arrange as necessary.
- Note: Please ensure that the message behind each note is correctly interpreted. Often, great ideas are lost by misunderstandings!
Benefits
Because you are grouping the issues that came up in the brainstorming, you will also get a sense of Priority in what needs to be addressed first. The more post-its a grouped topic has, the more important it is likely to be.
If the brainstorming was carried out by all the Key Stakeholders or a cross functional team, you will have a greater chance of really taking up the key issues that need addressing. What better way to get a team focused in? And to get Management Buy-In to what needs to be done?
Finishing up
Once you have grouped the topics and thereby finished the Diagram, you can then analyse further by carrying out a Cause and Effect Diagram.
Go to top of Affinity Diagram Page
Try Fiverr!
Free Online
Business Training

Online Course
- with Certificate -
Introduction To Quality Concepts

Training Course on Sale Right Now
Introduction To Quality Management Concepts.
Was: 69.95 Euros
Now: 49.95 Euros
So get your Certificate in Quality Management now, while the going is good!
FREE Ebook when you subscribe

Valuable tips, articles and updates delivered to your inbox every month
Recent Articles
-
What is Coaching, What is it not.
Feb 18, 21 07:04 PM
This article is about what is coaching, and what it is not. -
Cognitive Learning Style
Oct 31, 20 07:48 PM
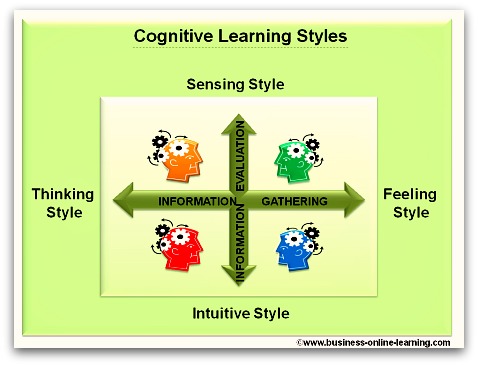 Get An Understanding Of Your Cognitive Learning Style And Become A Better Manager. By Understanding Yourself And Others Better, You will Be More Successful.
 -
Critically Questioning Information
Mar 26, 17 12:34 PM
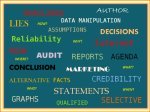 Data Manipulation Is Second Nature In Business, So How Good Are You At Critically Questioning Information? Get Advice Here.
Martha has exceptional, in-depth specialist knowledge.
Her work in eTraining resulted in immediate benefits and received wide acclaim by users worldwide, around the clock.
Her analytical thinking is reflected in her good judgement ability - in particular with interconnecting scenarios.
Her style of working and performance are characterised by meticulousness and reliability.
We deeply regret her leaving.
My last "BOSS"!

 My name is Martha and I have worked for over 30 years in various aspects of business and in various countries, right around the world.