Follow Us


Guidelines on the
Functional Flow Diagram
Just try it out!
This functional flow diagram like many of the other techniques is a clean, logical method for "Making Sense" of a situation.
It will be useful for you in gaining and communication an overview on and procedure, process or situation. It is an array of boxes and connecting arrows. Each box will represent
Materials used, or Resources involved, or Equipment.
1-2-3 of How To Do
A Functional Flow Diagram
- Start at the beginning point. Where should this list of functions, equipment or materials start?
- Then slowly brainstorm the logical sequence that follows by asking yourself, step by step; "What's Next?"
- Once you have your sequence, you can illustrate your functional flow diagram using the following rules.
Remember that these diagrams are usually there to communicate ideas or concepts to other, so add to the diagram any interpretations or assumptions you are making. Make your diagram easy to read by adding a legend!
Some Rules To Follow
- Arrows represent the flows of material or the sequence of activities.
- Use Phrases for activities, i.e. Verb +Noun
- Use a key to explain what is flowing
- By using different colours or different styles of arrows, you can indicate a multiple of flow types. For example Product A or Product B.
Example of a Functional Flow Diagram
Here is a simplified version of the production flow that exists in the manufacturing of Plastic lenses. You can see for yourself how cleanly you can communicate an overview of the production on just one page.
This has multiple benefits as I have mentioned already, training, discussion, problem solving and many, many more.

Benefits of the Functional Flow Diagram
- These diagrams are a great way to give others a quick overview of a scenario.
- They are useful in training in new staff or indeed, during audits or visits by customers.
- By having this overview, you are more likely to get consensus in teams as each will have the common understanding of what is being spoken about.
- By using the Functional Flow Diagram you are increasing your chances of finding opportunities to improve.
- It is a quick and easy method to learn and one that will bring a lot to the job you want to do.
For More Analysis Techniques, Check These Out:
Discover the method of System Diagrams. A Must in any Manager’s personal toolbox. It is the method with which most work will start.
Needing that extra insight in a Change Management situation? Check out the concepts in an Influence Diagram and how it can help you avoid those pitfalls.
Learn what an Information Flow Diagram is, how you can do one and how this can be useful in the intersections between Systems and Processes.
When you are setting up any production process or even any process, carry out the Control diagram. Take this tried and tested method as it will help you to evaluate and fail-safe any Process. It will help achieve an overview as well as help analyse areas of improvement.
Adopt this Network Diagram Method for the illustration of any network and the activities involved.
Discover the Method of Critical Path Analysis and how this can help you introduce improvements in the work being done.
The Gap Analysis Technique is a basic but extremely effective method of looking at where you are at, where you should be and what the difference is between the two states.
Learn how to use Story Mapping to gain extra insights into what you are about to do. A fully creative technique that is fun! Check it out!
Are you trying to change something? Need support in getting that strategy right? Try a Forcefield analysis to learn how best to do this!
Use CATWOE to check out the Goal or the Solution you have defined. Another creative technique that will give you amazing insights. Try it here!
Use the Spray Diagram Technique to quickly get a overview in a situation, a quick and easy skill to develop. Check it out here! For me personally, this technique is one of my most used and most versatile. I use it as much in my private life as I do in my professional!
Do you know where the power sits in your situation? Learn to use Relationship Diagrams and you will have the skill to assess these situations adeptly.
Learn what is a Cause and effect diagram or Fishbone Diagram. Learn how they can be useful and how you can utilize this sensible technique to achieve Continuous Improvement.
We have often heard about the Pareto analysis Method but do you know how it is really done? Learn how the technique functions and what it could mean for you.
Benefit from this Introduction to Check Sheets and how you can use them. Check Sheets are one of the Seven Basic Tools of Quality. Find out more!
Try Fiverr!
Free Online
Business Training

Online Course
- with Certificate -
Introduction To Quality Concepts

Training Course on Sale Right Now
Introduction To Quality Management Concepts.
Was: 69.95 Euros
Now: 49.95 Euros
So get your Certificate in Quality Management now, while the going is good!
FREE Ebook when you subscribe

Valuable tips, articles and updates delivered to your inbox every month
Recent Articles
-
What is Coaching, What is it not.
Feb 18, 21 07:04 PM
This article is about what is coaching, and what it is not. -
Cognitive Learning Style
Oct 31, 20 07:48 PM
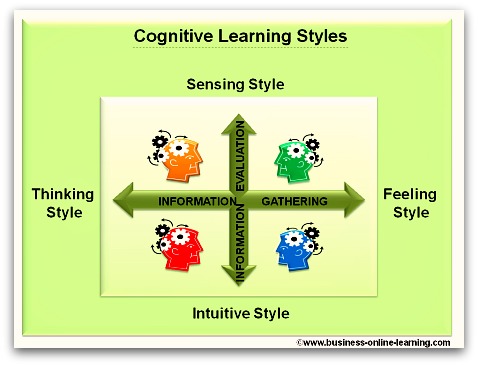 Get An Understanding Of Your Cognitive Learning Style And Become A Better Manager. By Understanding Yourself And Others Better, You will Be More Successful.
 -
Critically Questioning Information
Mar 26, 17 12:34 PM
 Data Manipulation Is Second Nature In Business, So How Good Are You At Critically Questioning Information? Get Advice Here.
Martha has exceptional, in-depth specialist knowledge.
Her work in eTraining resulted in immediate benefits and received wide acclaim by users worldwide, around the clock.
Her analytical thinking is reflected in her good judgement ability - in particular with interconnecting scenarios.
Her style of working and performance are characterised by meticulousness and reliability.
We deeply regret her leaving.
My last "BOSS"!

 My name is Martha and I have worked for over 30 years in various aspects of business and in various countries, right around the world.