Follow Us


Quality Management Tools
There are 7 basic Quality Management Tools.
These were originally formulated by Ishikawa in the 1960’s and 70’s based upon the teachings of E.Deming.
They were classified as being the basic tools needed in Quality Management. They did not require a lot of training to be executed to good effect and were suitable for a multitude of uses such as problem definition, problem analysis, problem solving, etc.
Ishikawa believed that over 95% of problems that would occur in a company could be addressed with these tools.
1. Cause and Effect Diagram
Also known as Ishikawa Diagram or Fishbone diagram because of its structure, it allows you to analyse the different causes that will lead to an “Effect”. It helps sort out the ideas into categories and to understand the inter-relationship or see-sawing effect between a cause and what will result. See cause and effect diagram.
2. Check sheets
This is a generic tool that can be used for a multitude of purposes. The issues are listed in the form and the data is collected for later analysis. See Check sheets.
3. Histogram
This is one of the most frequent types of charts. They show the distribution of the results or the distribution f the occurrence of a problem and how frequent each value has occurred.
4. Pareto Analysis
The Pareto bar chart helps analyse your results and as Pareto said, you will typically find that 80% of the problems were caused by 20% of the causes. To learn how to do a Pareto chart, see here.
5. Scatter Diagram.
These are used to find a relationship between the results or data you have recorded. The data is mapped in pairs, one variable on each axis.
6. Control Charts
Control Charts are charts where usually production results are documented. They have limits integrated in the charts to show when action needs to be taken, i.e. production stop, recheck, etc. The results are then statistically evaluated for degree of Control and reliability that no errors are occurring.
7. Stratification Diagram.
Also known as “Flowchart” or “Runchart” Data is collected from a variety of sources and using this technique, analysed for patterns that might be evident.
Further Quality Management Tools include:
- Quality Circles
- Critical to Quality tree
- Quality Function Deployment
- 5 Whys
- 5 S
- Gauge R&R
- Business Process Mapping
- Failure Mode and Effect Analysis
- Cost Benefit Analysis
- Control Models
And a whole pile more. Many of them are included in the Six Sigma Toolbox.
Conclusion: There is a wide variety of QM Tools available. We have listed the 7 basic Quality management tools from Ishikawa as they are the easiest to implement, the most multi-functional and widely known.
|
|
 Go To Start Of Training |
|
Go To Top of Quality Management Tools Page
Try Fiverr!
Free Online
Business Training

Online Course
- with Certificate -
Introduction To Quality Concepts

Training Course on Sale Right Now
Introduction To Quality Management Concepts.
Was: 69.95 Euros
Now: 49.95 Euros
So get your Certificate in Quality Management now, while the going is good!
FREE Ebook when you subscribe

Valuable tips, articles and updates delivered to your inbox every month
Recent Articles
-
What is Coaching, What is it not.
Feb 18, 21 07:04 PM
This article is about what is coaching, and what it is not. -
Cognitive Learning Style
Oct 31, 20 07:48 PM
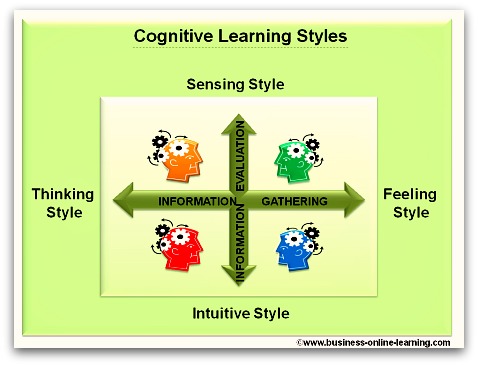 Get An Understanding Of Your Cognitive Learning Style And Become A Better Manager. By Understanding Yourself And Others Better, You will Be More Successful.
 -
Critically Questioning Information
Mar 26, 17 12:34 PM
 Data Manipulation Is Second Nature In Business, So How Good Are You At Critically Questioning Information? Get Advice Here.
Martha has exceptional, in-depth specialist knowledge.
Her work in eTraining resulted in immediate benefits and received wide acclaim by users worldwide, around the clock.
Her analytical thinking is reflected in her good judgement ability - in particular with interconnecting scenarios.
Her style of working and performance are characterised by meticulousness and reliability.
We deeply regret her leaving.
My last "BOSS"!

 My name is Martha and I have worked for over 30 years in various aspects of business and in various countries, right around the world.