Follow Us


How to do a Systems Diagram
Before I go into the "How to do a Systems Diagram", I would like to convey to you an understanding of what a system is. This explanation is vital for a great understanding of ANY system, be it a political, a Quality Management, a financial system or otherwise.
There are four main characteristics of a system that help our understanding. Please take particular note of these as they are very important:
- A system is an assembly of components that are connected in an organized way.
- The components are affected by being in the system and the behavior will be changed once any leave.
- This organized assembly of components does something.
- This assembly has been defined as being of particular importance or interest.
I find this type of diagram to be extremely useful when trying to assess any particular situation. As with many of the other problem solving or concept mapping techniques, it enables you to give a good overview that you can communicate quickly.
In particular, I have frequently used the concepts given in the definition of what a system is. Think of a system as being a balanced state that changes completely if one of the components leave that system.
This diagram can really help you evaluate what you are dealing with. At a very minimum you will develop a very sophisticated overview of any system which will be easily understood by all.
What is a Systems Diagram?
This method shows the components of a system and its surroundings at any one particular time, like a snapshot.
Some of the components can be grouped into subsystems or may have some overlapping content as shown in the diagram.
By virtue of the diagram, you can structure a situation and communicate to others better, what the system entails.
What you need:
- The rules of doing a systems diagram
- Usual Charting materials (pens, paper or charts).
Rules
Here is the basic concept:

1. The circles or “blobs” outlines a boundary separating this from other components or similar elements within the system.
2. Words are used to give each element or component a title.
3. The circles or “blobs” outside the system represent elements or components of the environment in which the system exists.
4. Within the system, you can have subsystems which are sets of components that belong together or function together to achieve some purpose or provide some means to an end.
5. The circles or “blobs” may overlap if there is some common ground between these elements or components. However, use these overlaps sparingly as they are likely to reduce the clarity of your Diagram.

How to do a Systems Diagram
- Be clear about your boundaries – especially your system boundary. This can be highlighted with thicker lines. The main thing is that the system wall is easily visible. A dashed line can be used in situations where the boundary is subjective and tentative.
- As mentioned earlier on, use overlaps sparingly. Never, ever use multiple overlaps as it will be virtually impossible to interpret overlaps of more than two overlaps.
- Use irregular “blobs” rather than boxes as boxes imply that the systems or sub-systems are clearly defined and that is rarely the case.
- You can use the size of the blobs to indicate the importance, size or other characteristics of the component it represents. Therefore, show important systems at a reasonable size and less important ones somewhat smaller. This makes it easier for the reader to understand what mean to convey.
- While there are no firm rules on the positioning of components, it makes sense to place important components in a central position and to place the related components close together.
- Leave space within your map. Not only does this allow components or elements to stand out clearly, but later you can add more if you wish or want to.
- Give a legend with the titles of all the components or elements in your illustration.
- Do not use lines, dashes, connectors or arrows in the systems diagram. (see Method of doing Influence Diagrams).
Go To Top of Systems Diagram Page
Try Fiverr!
Free Online
Business Training

Online Course
- with Certificate -
Introduction To Quality Concepts

Training Course on Sale Right Now
Introduction To Quality Management Concepts.
Was: 69.95 Euros
Now: 49.95 Euros
So get your Certificate in Quality Management now, while the going is good!
FREE Ebook when you subscribe

Valuable tips, articles and updates delivered to your inbox every month
Recent Articles
-
What is Coaching, What is it not.
Feb 18, 21 07:04 PM
This article is about what is coaching, and what it is not. -
Cognitive Learning Style
Oct 31, 20 07:48 PM
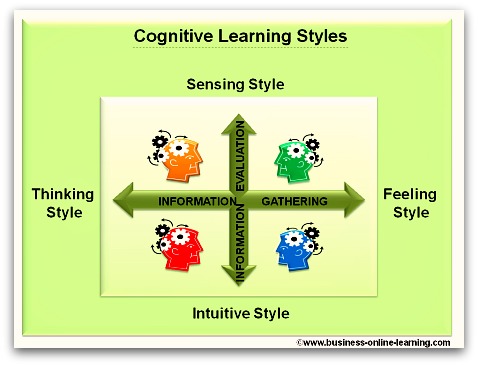 Get An Understanding Of Your Cognitive Learning Style And Become A Better Manager. By Understanding Yourself And Others Better, You will Be More Successful.
 -
Critically Questioning Information
Mar 26, 17 12:34 PM
 Data Manipulation Is Second Nature In Business, So How Good Are You At Critically Questioning Information? Get Advice Here.
Martha has exceptional, in-depth specialist knowledge.
Her work in eTraining resulted in immediate benefits and received wide acclaim by users worldwide, around the clock.
Her analytical thinking is reflected in her good judgement ability - in particular with interconnecting scenarios.
Her style of working and performance are characterised by meticulousness and reliability.
We deeply regret her leaving.
My last "BOSS"!

 My name is Martha and I have worked for over 30 years in various aspects of business and in various countries, right around the world.