Follow Us


Understanding The Powerful
Cause And Effect Diagram
The Cause and Effect Diagram was developed in 1982 by Kaoru Ishikawa (1915 – 1989) to determine root cause or causes to a problem. The cause and effect or Fishbone Diagrams, (because of their skeletal appearance) were used to help a group to identify and understand the underlying cause of a problem rather than the symptoms.
By illustrating your problem in this diagram method, it is easier to make sense of the data while at the same time enabling a broader picture of the problem.
The effect (a specific problem or quality characteristic) is considered to be the head.
Potential cause(s) and sub-causes of the problem or the quality characteristic are the bone structure of the fish.

The diagrams illustrate in a clear manner the possible relationships between some identified effect and the cause or causes influencing it.
They also help uncover the root cause of a problem as well as generate new ideas for improvement.
How to do a Cause and Effect Diagram
The Cause and Effect Diagrams are used typically by Quality Circles as part of the Brainstorming stage in a Quality Improvement Project. The first step is for the group to brainstorm the possible cause or causes. They then categorize these potential causes under specific headings, such as

Others list the 4M Fishbone diagram to include the specific headings
- Machinery
- Manpower,
- Method,
- Material and / or
- (Maintenance).
Some will exclude the Maintenance heading, resulting in a 4M Fishbone diagram. This can be very suitable for people starting out.
Others include a 6th category, “Mother Nature” giving rise to the 6M Diagram.

In other areas, the 4Ps can be used: Policies, Procedures, People and Plant.
As with any type of cause and effect diagram, the exact format is not as important as the process of determining the means of improving the situation under analysis.
Step By Step Method Of Doing A Cause And Effect Analysis
Step 1: Describe the problem or issue
Step 2: Choose the variation of the fishbone you want to use by choosing which categories seem most suitable.
Step 3: Brainstorm the categories for possible influencing causes of your issue.
Step 4: All this information is fed into the basic diagram. When complete, you are able to get a very clear picture of the nature of the issue.
Working from this diagram, you can decide on specific areas that need closer investigation or analysis. Remember you will need further methodologies to complete the analysis, a Cause And Effect diagram is not a standalone.
Depending on the situation, you can use
And many more.
The process of assessing priorities and elimination will allow the “Root Cause” or “Most Important Factor” of the issue to be found.
Example Of A Fish-bone Diagram

Collecting Data
Please note that when collecting data,
- Your team follow the target. Be very clear about why you are collecting particular information
- You check the relevance of the Data. Please ignore everything that is not relevant to the problem being investigated. Keep it simple to avoid confusion.
- Ensure that your Data is accurate and measurable. They need to be very carefully observed and recorded in terms of quantity, cost, time and quality.
- The Data must be representative. The data must accurately reflect normal conditions. For example, selecting data that is out of season is a misrepresentation of the real facts.
"If you are looking for a big opportunity, find a big problem.”
Anon
Look at more on Quality Assurance with:
 Quality Assurance Definition |
 Total Quality Control |
 Check Sheets |
 Myths about ISO9000 |
 Pareto Analysis |
 Supplier Quality Management |
 Critical To Quality Tree
|
 Quality Circles |
 Certification Process |
8D Tutorial |
 Quality Management Tutorial |
Go to Top of Cause And Effect Diagram Page
Try Fiverr!
Free Online
Business Training

Online Course
- with Certificate -
Introduction To Quality Concepts

Training Course on Sale Right Now
Introduction To Quality Management Concepts.
Was: 69.95 Euros
Now: 49.95 Euros
So get your Certificate in Quality Management now, while the going is good!
FREE Ebook when you subscribe

Valuable tips, articles and updates delivered to your inbox every month
Recent Articles
-
What is Coaching, What is it not.
Feb 18, 21 07:04 PM
This article is about what is coaching, and what it is not. -
Cognitive Learning Style
Oct 31, 20 07:48 PM
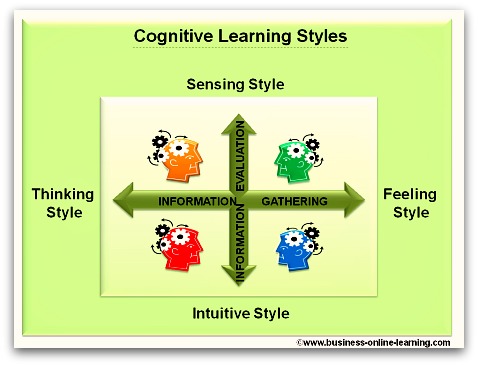 Get An Understanding Of Your Cognitive Learning Style And Become A Better Manager. By Understanding Yourself And Others Better, You will Be More Successful.
 -
Critically Questioning Information
Mar 26, 17 12:34 PM
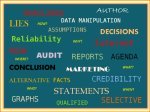 Data Manipulation Is Second Nature In Business, So How Good Are You At Critically Questioning Information? Get Advice Here.
Martha has exceptional, in-depth specialist knowledge.
Her work in eTraining resulted in immediate benefits and received wide acclaim by users worldwide, around the clock.
Her analytical thinking is reflected in her good judgement ability - in particular with interconnecting scenarios.
Her style of working and performance are characterised by meticulousness and reliability.
We deeply regret her leaving.
My last "BOSS"!

 My name is Martha and I have worked for over 30 years in various aspects of business and in various countries, right around the world.